Please note: Electricity: The spark of life ended in April 2019. To find out what exhibitions and activities are open today, visit our What’s On section.
Within the Electricity: The spark of life exhibition at the Science and Industry Museum, there is a model of the electricity use in Manchester over a year made of stacked cards, which have been cut into the shape of the usage graph to show consumption across the day and throughout the year. If you look carefully, you might be able to see some odd peaks which correspond to big national events such as Christmas and Easter.
Electricity North West distribute electricity across the North West of England from Derbyshire to the Scottish border, and whilst we don’t do quite so much cutting out any more, we do measure how much energy is flowing using sensors across our network reporting back to our control centre in central Manchester. We use this information to make sure that everything is running as it should, to quickly restore power if something goes wrong and to plan where we need to invest to make sure that our network can continue to provide the supplies our customers need into the future.
Do spikes in demand still happen?
It’s often said that there is a spike in demand when Coronation Street finishes or at half-time in the World Cup Final, but does this still happen?
The short answer is that we don’t really see it in the load records, partially because electricity load is recorded as half-hourly averages (so a short peak wouldn’t really show up) and partially because of the change in viewing habits over recent years with the advent of streaming, so there are fewer times when lots of people are watching the same thing.
But what about when they are, like when England played Sweden in the 2018 World Cup? Well, if we compare the load in the North West on 7 July with that for every other Saturday that summer, the profile for 7 July matches well but with two notable blips where the load was lower than normal. As it happens, these blips coincide with the England-Sweden game (15.00–17.00) and later the Russia-Croatia game (19.00–21.30).
So what is going on?
Its hard to say exactly, but to speculate, perhaps people were crowded round TVs watching the games rather than doing other things. TVs, along with most household appliances, have got far more efficient over recent years (which explains why overall electricity demand is currently falling), and perhaps rather than putting the kettle on, people went for the beers in the fridge as it was warm in the UK at the time. Either way, given the scale of the event, the effect is fairly small, only 2–3% of the average load across the day.
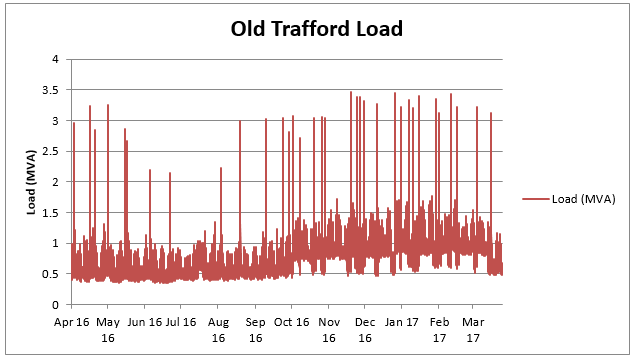
There are some places where events make a big difference though…
Any idea when United were playing?
The featured image on this page shows Stanley Matthews playing football in 1961. It is part of the Daily Herald Archive at our sister museum, the National Science and Media Museum in Bradford.

